
Learn Kyanos in 5 Minutes
Kyanos has three main subcommands: watch, stat, and overview. Here’s what each command does:
- watch: Captures network traffic according to specified options and automatically parses it into request-response records.
- stat: Aggregates request-response records based on specified conditions, providing higher-level statistical information.
- overview: Displays external resources that the current machine relies on in a single command.
Basic Usage of Traffic Capture with watch
The simplest usage captures all protocols traffic currently supported by Kyanos:
./kyanos watchEach request-response record is displayed as a row in a table. You can use the arrow keys or j/k to move up and down through the records: 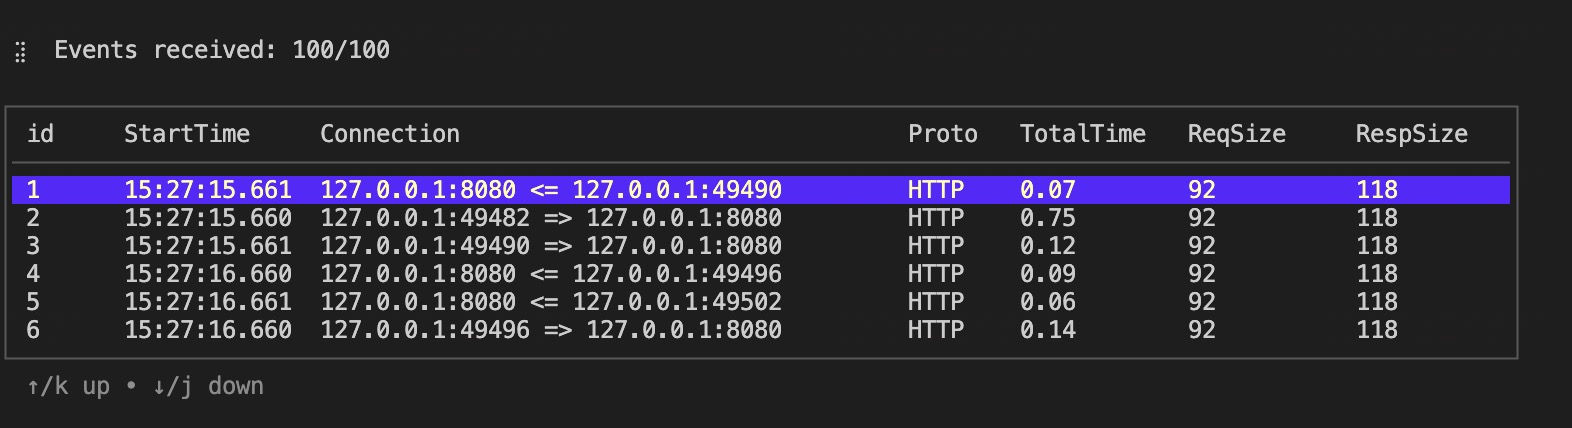
Press Enter to access the details view:
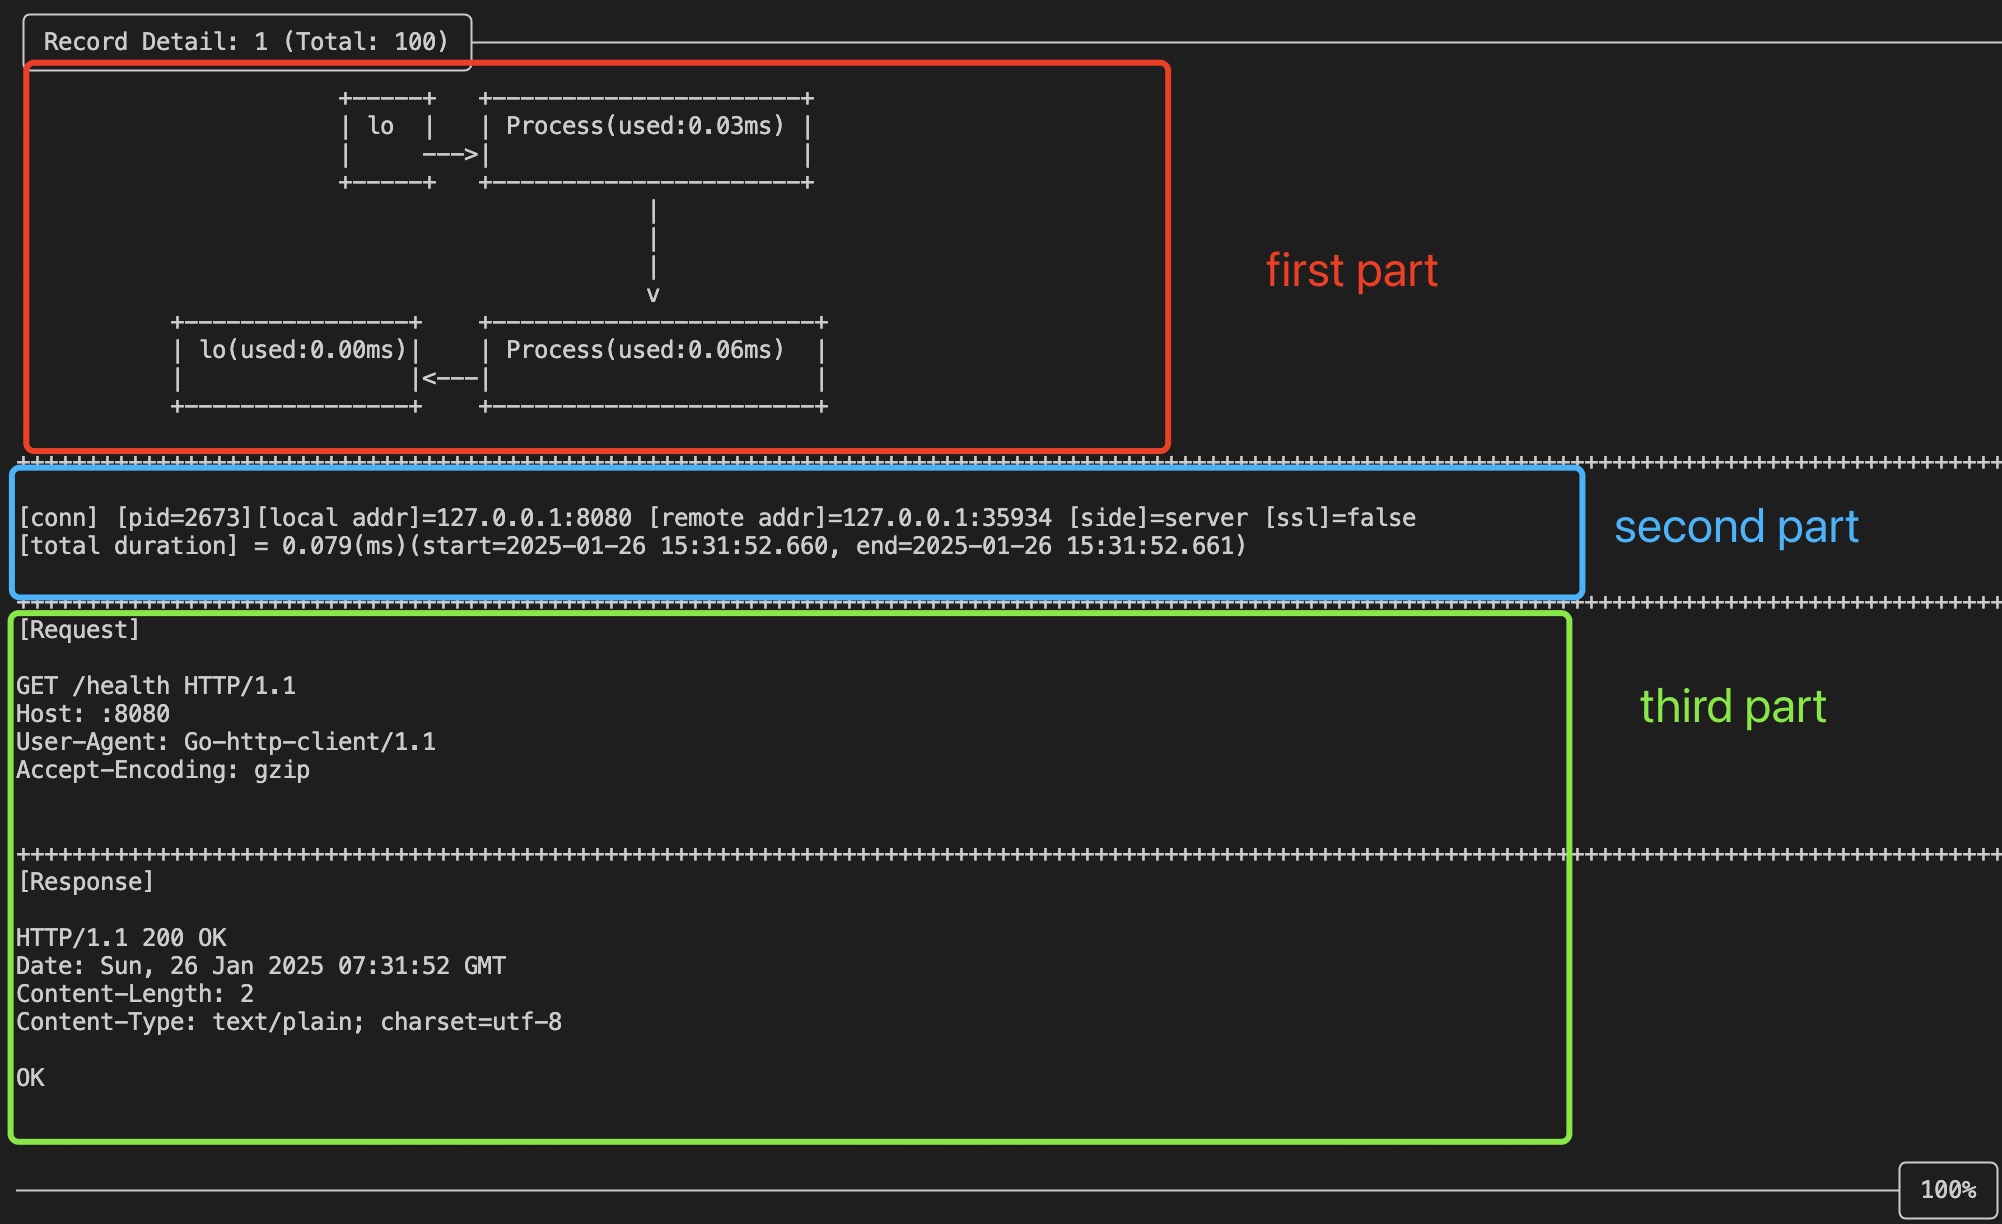
The first part of the details page is Latency Details. Each block represents a node that the data packet passes through, such as processes, network cards, socket buffers, etc. Below each block, there is a latency value, which indicates the time taken from the previous node to this node. You can clearly see the process of the request being sent from the process to the network card, and the response being copied from the network card to be read by the process, along with the latency of each step.
The second part is Basic Information of the Request and Response, which includes the start and end times of the request and response, the size of the request and response, etc.
The third part is Specific Content of the Request and Response, divided into Request and Response sections. Content exceeding 1024 bytes will be truncated for display.
For more precise traffic capture, such as HTTP traffic:
./kyanos watch httpYou can narrow it down further to capture traffic for a specific HTTP path:
./kyanos watch http --path /abcEach protocol has different filtering options. For more details, see: How to Capture Request-Response and Latency Details
Basic Usage of Aggregated Analysis with stat
In real-world scenarios, watch output is often too granular. Therefore, Kyanos offers the stat command for statistical analysis.
In short, stat can help answer questions like: Which connections have the highest request count? Which remote servers have the highest average latency? Which clients consume the most bandwidth?
For example, to find remote servers with the highest average latency, use the --slow option to focus on latency. Like watch, stat can apply all filtering options supported by watch. Here, we’ll collect only HTTP requests with PATH=/abc:
./kyanos stat http --slow --path /abcBy default, Kyanos will collect data for 10 seconds (modifiable with the --time option, or press ctrl+c to stop early): 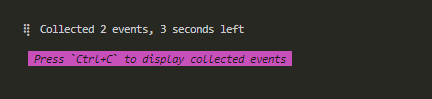
After 10 seconds, the collected results are displayed in a table:
    Colleted events are here!

┌──────────────────────────────────────────────────────────────────────────────────────────────┐
│ id   remote-ip        max(ms)     avg(ms)     p50(ms)     p90(ms)     p99(ms)     count      │
│──────────────────────────────────────────────────────────────────────────────────────────────│
│ 0    169.254.0.4      108.59      60.36       64.00       128.00      128.00      3          │
│ 1    180.101.50.242   11.56       11.56       16.00       16.00       16.00       1          │
│ 2    180.101.50.188   11.98       11.51       13.33       16.00       16.00       3          │
│                                                                                              │
│                                                                                              │
│                                                                                              │
└──────────────────────────────────────────────────────────────────────────────────────────────┘
  ↑/k up • ↓/j down

  1 sort by name • 2 sort by max • 3 sort by avg • 4 sort by p50 • 5 sort by p90 • 6 sort by p99 • 7 sort by count • 8 sort by total
Each row in the watch output represents a single request-response, while stat aggregates request-responses by a specified dimension.
In this example, since no specific dimension was set, the remote server address (remote-ip) is used as the default aggregation dimension (displayed in the second column). This means that request-responses from the same remote IP are aggregated together (though this is just one way to aggregate; for more options, refer to Traffic Analysis).
Let's shift our focus to each column of the table: the max column shows the maximum latency among the aggregated request-responses for each remote IP, while the avg column shows the average latency, and so on. If an issue arises with a remote server, you can quickly identify the problematic server by comparing metrics for different remote IPs, such as noticing an anomaly for IP 169.254.0.4.
To view detailed request-response information for a specific remote IP, move cursor to that row and press Enter to access the list of request-responses for that remote-ip:
 Events Num: 3

┌───────────────────────────────────────────────────────────────────────────────────────────────────────────────────────────────────────────────────┐
│ id     Process               Connection                                Proto   TotalTime↓  ReqSize     RespSize    Net/Internal   ReadSocketTime  │
│───────────────────────────────────────────────────────────────────────────────────────────────────────────────────────────────────────────────────│
│ 1      1315398<barad_agent>  10.0.4.9:38458 => 169.254.0.4:80          HTTP    108.59      564         216         107.18         1.36            │
│ 2      1315398<barad_agent>  10.0.4.9:38482 => 169.254.0.4:80          HTTP    45.89       676         216         43.83          2.00            │
│ 3      1315398<barad_agent>  10.0.4.9:38470 => 169.254.0.4:80          HTTP    26.60       588         216         25.21          1.30            │
│                                                                                                                                                   │
└───────────────────────────────────────────────────────────────────────────────────────────────────────────────────────────────────────────────────┘
  ↑/k up • ↓/j down
The format of the display here is actually the same as that shown by the watch command—each row represents a request-response record. You can further explore each record by pressing Enter to view detailed latency and content information for the selected request.
TIP
The stat command offers powerful capabilities, so it’s highly recommended to explore other use cases in How to Aggregate and Analyze.
Next Steps
To learn the details for each command:
- For the
watchcommand, see: How to Capture Request-Response and Latency Details - For the
statcommand, see: How to Aggregate and Analyze